The CTV app install is the beginning of the measurable business journey, not the end.
The install can be real and still not be valuable
Imagine a streaming campaign that delivers 50,000 CTV app installs at an efficient cost. On the acquisition dashboard, it looks successful. But only 55% of those installs produce a verified first open, 32% produce a first stream, and 12% of the original cohort is still viewing 30 days later.
Nothing about the install number is wrong. The problem is asking it to answer a question it cannot answer. An install shows that distribution expanded. It does not show that someone watched, returned, generated revenue, or stayed long enough for the economics to work.
For streaming leaders, the better question is: after marketing created CTV access, did the acquired cohort create durable business value?
One KPI cannot answer the whole journey
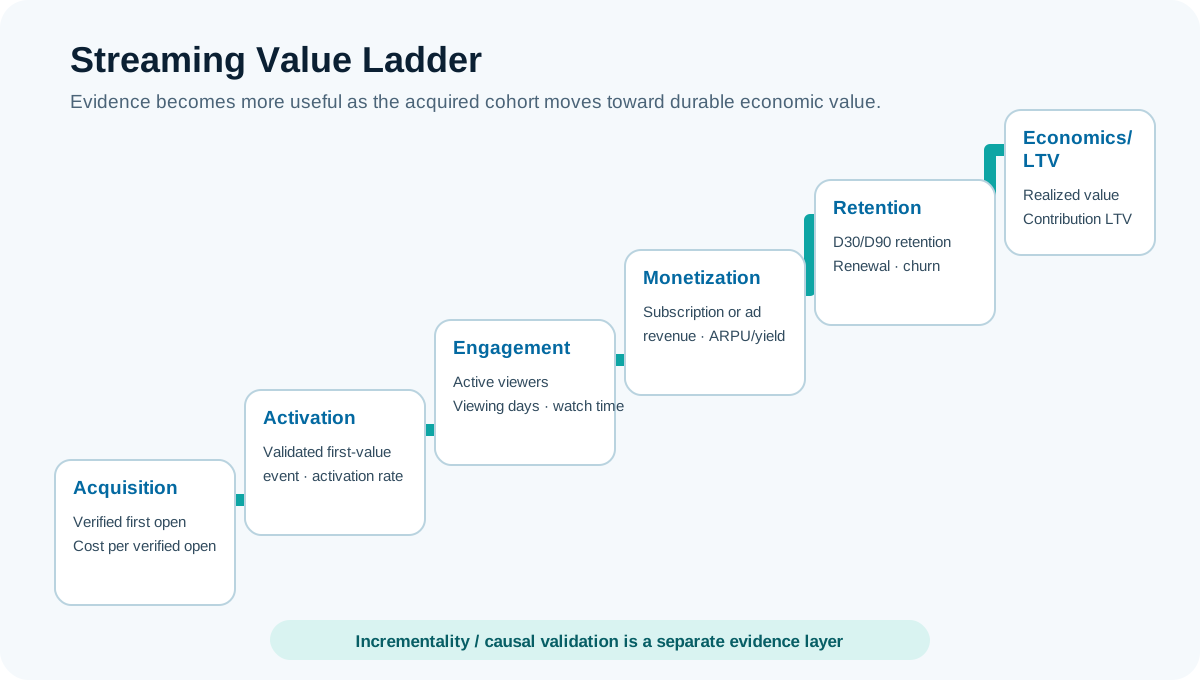
The customer journey after acquisition is a sequence of different management questions. Each stage provides stronger evidence than the one before it.
| Stage | What it tells you | Example metrics |
|---|---|---|
| Acquisition | Did we create access to the CTV experience? | Install, verified first open, cost per verified open |
| Activation | Did the acquired user reach the first meaningful value event? | First stream, sign-in, completed session, activation rate |
| Engagement | Did the user meaningfully consume and return? | Active viewers, viewing days, watch time, return frequency |
| Monetization | Did the behavior create revenue? | Subscription revenue, ad revenue, ARPU, yield |
| Retention | Did the customer or viewer remain valuable? | D30/D90 retention, renewal, churn, reactivation |
| Economics | Did acquisition create enough long-term value? | Contribution LTV, CAC:LTV, payback period |
Acquisition and activation are different
An install is an acquisition milestone. A verified first open is stronger because it confirms that the CTV app was actually accessed. But even an open can end immediately.
Roku's current App Engagement Report makes this distinction explicit. It separates new installs from visitors and streaming viewers, and it measures bounce rate when visitors open an app without streaming content. Roku also describes streaming activity among installed accounts as a leading indicator of retention. That platform-level distinction reinforces a broader operating principle: access is not the same as consumption.
Activation should therefore be defined as the earliest behavior that a service's own data shows is meaningfully associated with later retention or monetization. For one service, first stream may be the right signal. For another, it may be sign-in, profile setup, a completed viewing session, or another event. The event should be validated, not chosen because it is easy to count.
Engagement shows whether the acquired cohort actually consumes and returns
Once a user activates, the next question is whether the behavior becomes meaningful. Viewer count, viewing days, session frequency, content starts, completion, and watch time all provide useful signals, but none should be treated as a universal definition of value.
Watch time can support both retention and ad monetization, but the economics depend on the business model, content cost, ad yield, subscription tier, and cohort quality. A leadership scorecard should focus on a small number of metrics while keeping deeper diagnostics available underneath.
Business value depends on the streaming model
The same post-install behavior can have different economic meaning depending on how the service makes money.
SVOD
For a subscription service, the journey may move from install to activation, trial, paid conversion, repeat viewing, renewal, and eventual churn. The economic endpoint is not the subscription event by itself. Leaders need to compare acquisition cost with the contribution value generated before the customer leaves, and understand whether the cohort reaches an acceptable payback period.
AVOD and FAST
For an ad-supported service, there may be no subscription event at all. Value can come from retained active viewers, viewing depth, monetizable ad opportunities, fill, yield, and the contribution revenue generated by that viewing. A viewer who returns consistently can be economically valuable even without a paid relationship.
Hybrid services
Hybrid services need both views. Subscription and advertising economics can coexist, which makes a single universal post-install KPI even less useful.
Retention changes the economics of acquisition
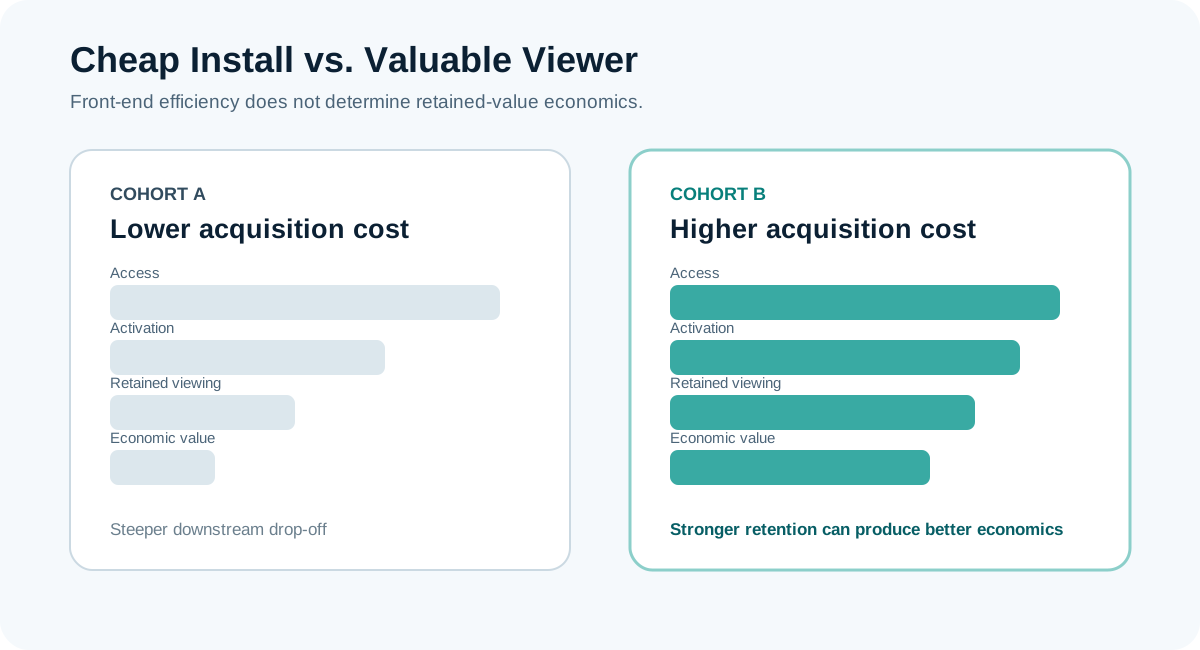
A low-cost install can become expensive when the acquired cohort does not stay. A higher-cost channel can be the better investment when its users are more likely to activate, return, monetize, and remain valuable.
Consider two channels. Channel A produces installs at $4.00. Channel B produces them at $6.50. If Channel B users sign in more often, stream on more days, and remain active 90 days after acquisition (D90), the higher front-end cost can produce better retained-value economics.
This matters in a market where churn remains persistent. Deloitte's March 2026 Digital Media Trends reporting says 41% of surveyed U.S. consumers had canceled any paid SVOD service in the prior six months. That is an aggregate consumer churn measure across paid SVOD services, not a single-service churn rate. The management implication is still important: acquisition quality cannot be judged without retention.
The full journey does not require a perfect customer graph
In practice, the data rarely sits in one place. CTV platforms may observe installs and viewing. Product analytics may observe activation and engagement. Billing systems know subscriptions and renewals. Ad systems know monetization. MMPs and attribution systems connect some marketing touches to outcomes. Identity and CRM systems connect known users where appropriate.
CTV also creates a basic identity problem: the television can represent a household while account, mobile, and CRM data may represent an individual. Privacy, consent, platform rules, delayed outcomes, and different event keys add more gaps.
That does not make full-journey measurement impossible. It means leaders should accept partial observability. Cohorts by source, campaign, acquisition date, platform, or activation status can reveal downstream quality even when person-level stitching is incomplete. The goal is a decision-useful view of value, not a fictional perfect identity graph.
Build an executive scorecard, not a giant dashboard
The leadership view should stay small enough to support decisions. Diagnostic reporting can sit underneath it.
| Leadership question | Suggested top-level metric |
|---|---|
| Acquisition | Verified CTV first opens and cost per verified open |
| Activation | Percent of verified opens reaching the validated first-value event |
| Engagement | Retained active viewers plus viewing days or watch time per retained viewer |
| Monetization | Revenue per acquired cohort, separated by subscription and/or advertising model |
| Retention | D30/D90 active or paid retention, with churn and reactivation where relevant |
| Economics | Realized cohort value, contribution LTV, CAC:LTV, and payback |
Measure the value that happens after access
CTV installs matter. They show that marketing and distribution created access. But the install should not become the definition of success simply because it is the easiest event to measure.
The stronger operating discipline is to follow the acquired cohort forward: Did they activate? Did they watch? Did they return? Did they monetize? Did they stay? Did the value justify the acquisition cost?
Streaming growth becomes more useful when the scorecard follows the economics of the customer or viewer, not just the first measurable event.
References
- Roku Developer. “App Engagement Report.” Updated 2026.
- Roku Developer. “Analytics Reports.” 2026.
- Roku Ads Manager. “Event tracking and reporting FAQ.” March 2, 2026.
- Roku Ads Manager. “Using a Mobile Measurement Provider (MMP).” June 22, 2026.
- IAB Europe. “CTV Measurement Framework.” 2026 public-comment framework.
- IAB. “The Role of Conversion API in Closing the Outcome Gap for CTV.” October 2025.
- IAB. “Building a Suite of Truth.” 2026.
- Media Rating Council. “MRC Outcomes and Data Quality Standards.” Final standards.
- Deloitte Insights. “2026 Digital Media Trends.” 2026.
- Deloitte Insights. “Digital Media Monitor.” 2026.
AI Transparency
CTVBridge uses AI tools to support research, content development, and editorial review. All articles are reviewed and approved by a human editor, and factual claims are supported by cited sources.