One customer. One new TV endpoint. Two very different outcomes.
Imagine an existing subscriber who has spent the last six months watching mostly on a phone. The service encourages that customer to activate the app on a living-room TV. The customer does it.
A platform dashboard may call that a success immediately: one more CTV activation. But from a business perspective, two very different things could have happened.
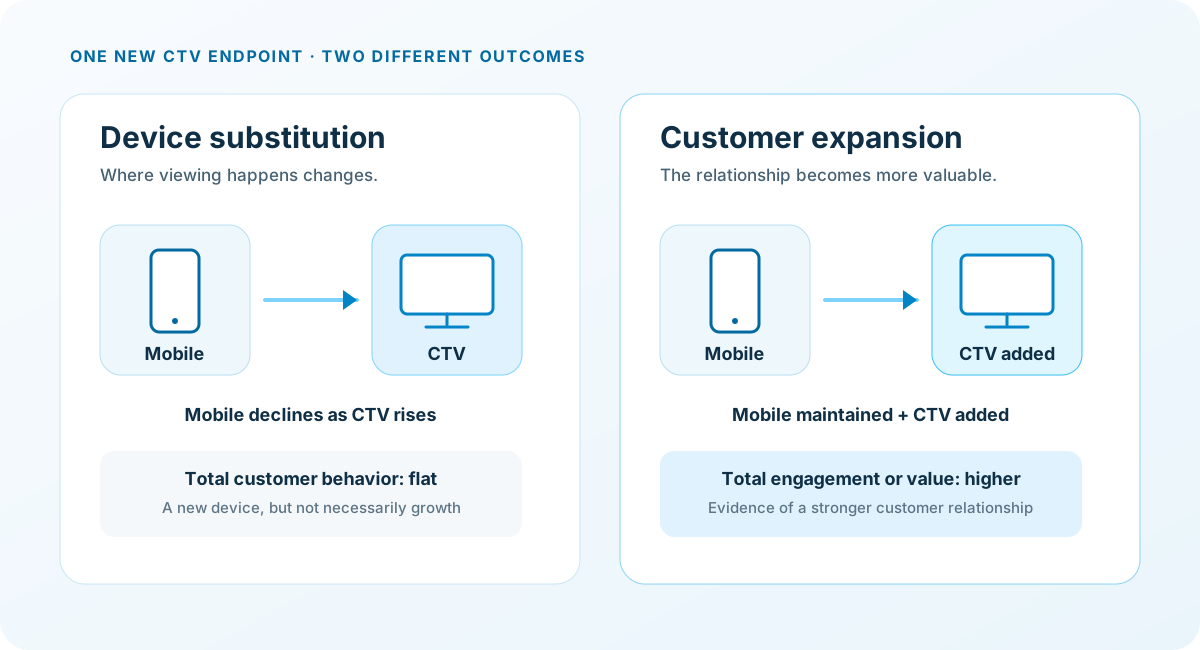
Device substitution: some viewing moves from mobile to TV, while total customer viewing stays roughly the same.
Customer expansion: the new TV endpoint adds meaningful viewing, supports longer or more frequent consumption, improves retention, creates more monetizable activity, or otherwise makes the relationship more valuable.
Those outcomes should not be reported as the same kind of growth. The first expands where the customer watches. The second expands the value of the customer relationship.
That distinction matters as streaming continues to take a larger share of television. Nielsen reported that streaming represented 48.6% of total U.S. TV usage in May 2026. Roku also reported more than 100 million Streaming Households worldwide in April 2026. Scale makes cross-device behavior increasingly normal, but scale by itself does not prove that adding another endpoint creates incremental value.
Define expansion in business terms, not device terms
For an existing streaming customer, expansion should mean a measurable increase in the economic or strategic value of an already-known relationship after that relationship extends to another device, platform, viewing context, or product surface.
That can take several forms:
| Expansion dimension | What you can observe | The business test |
|---|---|---|
| Device | An existing account activates a new CTV, mobile, tablet, or web endpoint. | Did total qualified usage or customer value increase, or did behavior simply move? |
| Engagement | More active days, viewing hours, completed titles, or live-event participation. | Did total qualified usage increase at the customer or account level after accounting for substitution? |
| Monetization | Upgrade, add-on, more ad-supported viewing, or lower churn. | Did contribution or expected lifetime value improve? |
A new device ID, an install without authenticated use, or a new CTV session by itself is not enough. Those are useful signals, but they are inputs to the measurement process rather than the business definition of expansion.
The first mistake: treating devices as customers
Account, household, profile, person, and device are different measurement units. CTV makes the distinction especially important because the television is commonly a shared household surface. Nielsen and IAB guidance both describe the difficulty of moving from a CTV device or household signal to certainty about the individual person watching.
CTV is primarily a household environment, so expansion measurement should start by being explicit about the identity level the data can actually support. When a service has authenticated user accounts and the right cross-device data infrastructure, an account ID can provide a useful first-party link across devices. Without that authentication, device, household, profile, and modeled signals should not be treated as proof of an individual customer relationship.
Household-level expansion can still be valuable. A service may see broader shared-screen usage, more viewing occasions, or stronger monetization after CTV activation. The important point is to measure and describe that value at the level the available identity signals can support rather than automatically translating household activity into individual users.
The second mistake: measuring every platform separately
Streaming data often lives in separate systems: billing, authentication, mobile analytics, web analytics, CTV telemetry, CRM, ad systems, and experimentation platforms. When each platform is reported independently, the organization can see activity without seeing the customer relationship.
Substitution is one possible outcome, but it should not be assumed. With authenticated accounts and a cross-device data stack that can connect activity reliably, a service may find that some mobile viewing moves to CTV while total viewing stays flat. It may also find that CTV adds new viewing on top of existing mobile behavior. The measurement task is to distinguish those outcomes rather than treating every new CTV hour as net-new engagement.
Where the identity and analytics infrastructure allow it, substitution should be made visible. Teams should compare total behavior across connected devices and ask how much new CTV activity was offset by declines elsewhere. They should also evaluate whether the shift changed monetization, retention, or relationship quality. For ad-supported services, a move toward CTV can improve revenue even when total viewing is flat because CTV inventory often commands premium CPMs relative to many other digital environments.
A five-stage ladder for measuring expansion
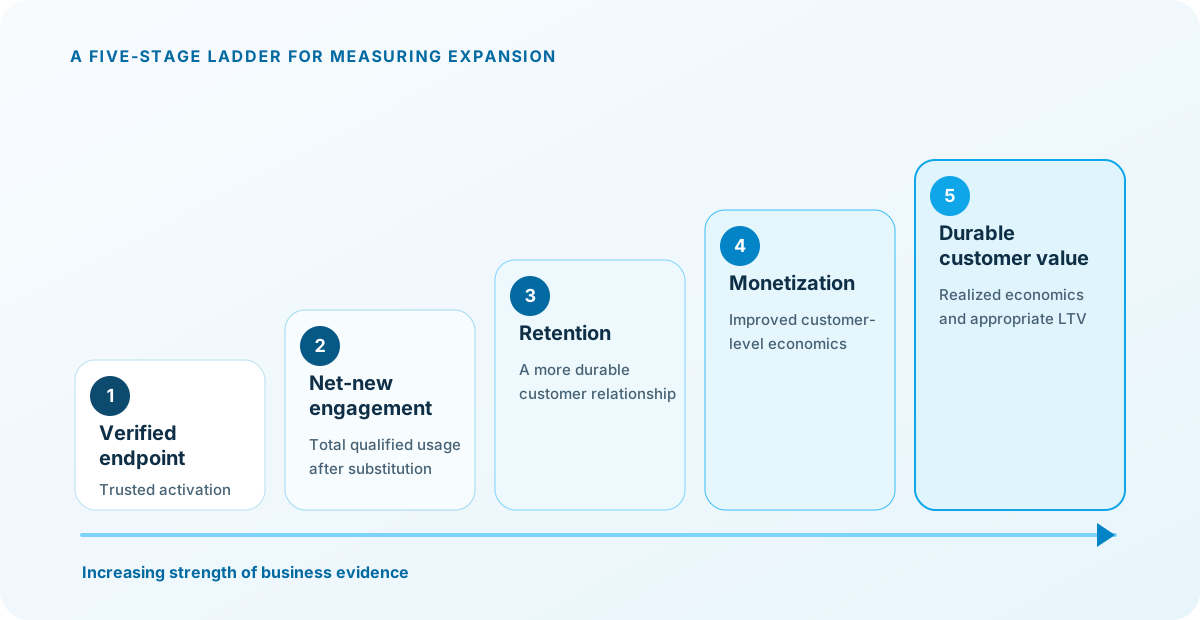
A practical way to manage this is to treat expansion as a ladder of increasingly valuable evidence. Each stage answers a stronger business question than the one before it.
1. Verified endpoint
Business question: Did the known customer actually activate and use the new device?
Evidence: Verified new-device activation tied to the existing account.
2. Net-new engagement
Business question: Did total customer behavior increase?
Evidence: Change in active days, viewing hours, sessions, completion, or continuity across devices.
3. Retention
Business question: Did the relationship become more durable?
Evidence: Renewal or churn improvement after accounting for prior customer behavior.
4. Monetization
Business question: Did the economics improve?
Evidence: Net change in subscription, add-on, advertising, or contribution margin after the new endpoint is added.
5. Durable customer value
Business question: Was the expansion worth the investment?
Evidence: Realized cohort economics and, where appropriate, modeled expansion LTV.
The ladder is not a requirement that every team wait for a perfect lifetime-value study before making decisions. Verified activation and customer-level engagement can be useful operational indicators. The important discipline is to label the evidence correctly and avoid turning an early signal into a stronger claim than the data supports.
The economic endpoint changes by streaming model
The same measurement ladder can work across streaming businesses, but the final value metric should match the business model.
SVOD: lower churn, higher renewal, upgrades, add-ons, bundle durability, and contribution margin may matter most.
AVOD/FAST: net-new monetizable viewing, ad impressions, yield, and net advertising contribution may be the stronger endpoint.
Hybrid services: the value can come from both retention and advertising, so the customer-level model should avoid optimizing one side while ignoring the other.
Three practical examples
SVOD: mobile-first subscriber activates the TV
A six-month subscriber receives an authenticated device-pairing prompt and activates the service on Roku. The weak conclusion is that the campaign generated a Roku activation. The stronger conclusion is that it generated a verified activation tied to an existing subscriber. The business conclusion comes only after comparing total viewing, retention, and economics with an appropriate baseline or control.
AVOD/FAST: mobile viewing expands into the living room
An authenticated free user adds a CTV endpoint. CTV ad impressions increase, but the right question is whether total customer or household viewing increased after accounting for any decline on mobile. Net-new monetizable activity after substitution is accounted for can be treated as expansion value. Even when total viewing is flat, teams should still check whether the shift to CTV changed yield, retention, or other economics.
Sports: continuity across devices
A fan receives a mobile alert for a live event, starts watching on the phone, and continues on the television. Two sessions do not necessarily represent two separate wins. The product value may be the continuity itself: higher event completion, repeated weekly viewing, and stronger retention.
An executive scorecard for existing-customer expansion
| Metric | What it tells you | Guardrail |
|---|---|---|
| Verified new-device activation | Did an existing customer establish a trusted new endpoint? | Exclude installs without meaningful use and re-installs where possible. |
| Multi-device active rate | How much of the active base uses multiple device classes? | Do not infer individual viewers from shared devices. |
| Substitution rate | How much new-device activity replaced activity elsewhere? | Measure total customer behavior, not platform growth alone. |
| Net-new engagement | Did total qualified usage increase after accounting for substitution? | Measure the observed customer-level change; do not imply causal lift. |
| Post-expansion retention | Did expanded customers remain active or paid over time? | Compare with prior behavior and relevant cohorts; do not present association as causal proof. |
| Net monetization change | Did customer-level economics improve after accounting for substitution? | Net out incentives, platform, content, and operating costs. |
| Expansion LTV | Did expected long-term value improve? | Distinguish modeled LTV from realized cohort economics. |
The operating principle
Existing-customer expansion is a measurement problem before it is a device-distribution success story. The decisive shift is to manage the relationship across devices instead of managing the device count.
Verify the endpoint. Measure across devices at the identity level your data can support. Make substitution visible where the technology allows it. Then connect the observed change to retention, monetization, and durable value.
A new device can be an important step in the customer journey. It becomes growth when the customer relationship is stronger because of it.
References
- Nielsen. Streaming Embarks on Annual Summer Ascent in Nielsen’s May 2026 Gauge Reports July 28, 2026.
- Roku. Roku Q1 2026 Shareholder Letter 2026.
- Nielsen. What’s the difference between OTT, CTV and streaming? 2024.
- Nielsen. What is co-viewing, and why should you care? 2024.
- IAB. The Anatomy of a Video Impression December 2024.
- IAB Tech Lab. CTV Programmatic Guide Accessed August 2026.
- Braze. Boost Your Cross-Platform Data and Engagement Strategy with Braze Connected TV Support April 9, 2020.
- Federal Trade Commission. FTC Releases New Report on Cross-Device Tracking January 23, 2017.
- Media Rating Council. Cross-Media Audience Measurement Standards (Phase I Video) Current standard; accessed August 2026.
- Nielsen. Nielsen deduplicates audiences across leading smart TV and streaming providers May 19, 2022.
AI Transparency
CTVBridge uses AI tools to support research, content development, and editorial review. All articles are reviewed and approved by a human editor, and factual claims are supported by cited sources.